
Concerned About Lung Cancer?
The Science behind the test…
THE SCIENCE
INNOVATIVE APPROACH
 PAULAs test is more than just a lab test. It uses an innovative way to calculate lung cancer risk which combines the results from multiple protein biomarker blood tests and important data from your own personal health history to generate the most accurate lung cancer risk profile available.
TUMOR MARKER TESTING
PAULA’s Test starts by testing several cancer markers, known tumor markers, which are proteins associated with the presence of cancer or other causes.  This tumor markers can be elevated in persons with cancer at the early stages of development, even though no symptoms may yet appear.
These marker tests include CEA (carcinoembryonic antigen), CA 125 (carbohydrate antigen 125), CYFRA 21-1 (cytokeratin-19 fragment 21-1 ) and NY-ESO-1, an autoantibody (New York esophageal cancer-1).
Our unique approach involves measuring two distinct types of analytes circulating in the blood: tumor antigens and autoantibodies. The tumor antigens have individually and collectively been shown by dozens of outside investigators around the world to distinguish early LC from risk-matched controls.
The combination of “established†biomarkers with more unique analytes such as autoantibodies coupled with advanced statistical scoring algorithm provides an optimal panel for screening diverse, asymptomatic patient populations.
RISK CALCULATING ALGORITHM
A risk calculating algorithm utilizes machine learning technology to combine the tumor biomarker test values with your relevant clinical factors (age, smoking history, and prior lung ailments) to generate a composite score categorizing the risk that the patient has LC.
WHY IS THIS APPROACH IS BETTER
The accuracy of the current version of PAULAs test was recently validated using an independent set of 400 samples from high risk patients obtained from the Cleveland Clinic in a blinded study [download here] and an additional 134 serum sample set purchased from commercial vendor (Indivumed).
The highest accuracy of PAULAs test was achieved by combining clinical features and biomarker results for patients within PAULAs test inclusion criteria (50 years of age or older who were current or former smokers with a smoking history of greater than 20 packs per year and less than 15 years of smoking cessation). Based on the Random Forest statistical algorithm the test yielded the following performance: 75% sensitivity, 80% specificity, 0.87 AUC (diagnostic accuracy) when both biomarker values (CEA, CYFRA, CA125 and NY-ESO1) and clinical factors (age, smoking history, pack-years and COPD status) were considered.
Random Forest (RF) modeling of the clinical factors and biomarker values alone yielded an average AUC of 0.66 and 0.84, respectively. When combined with the 4-biomarker panel, the AUC improved to 0.87.
EVIDENCE OF RESULTS
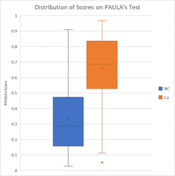 The test generates a composite score from the Random Forest model comprising 4 clinical parameters and the levels of 4 biomarkers in patient serum. The score ranges on a scale from 0 – 100 with higher scores correlating to an increased likelihood of having cancer.
This score is an indicator of the level of risk for each patient of currently having lung cancer relative to others with a comparable smoking history. Using two cutoffs (50.3 and 74.1), the test results were broken down into three separate categories with increasing risk factors (Table). The table below indicates the probability of lung cancer for patients in a given score range at the time of testing. Positive predictive value (PPV) is the probability that person with a positive test score above the chosen cutoff truly have the disease. Unlike sensitivity and specificity, the PPV is dependent on the population being tested and is influenced by the prevalence of the disease. For the PPV calculation we used 0.83% lung cancer prevalence from the NLST study [ ]. The Table shows that the higher patient’s score on PAULAs test the greater the likelihood that this patient does have cancer.
Table. Test PPV in 3 separate score categories
| Score Range | Sensitivity | Specificity | PPV | Increased likelihood |
| X ≥ 74.1 | 43.9% | 95.4% | 7.4% | 8.9X |
| X ≥ 50.3 | 75.4% | 79.8% | 3.0% | 3.7X |
| X < 50.3 | – | – | 0.83% |  1X |
Below the cutoff of 50.3 test will not differentiate between cancer and non-cancer. Individuals whose scores fall within this range have the same likelihood of having lung cancer as those people currently recommended for LCDT by the USPTF (0.83%). Individuals whose scores fall within the middle range are 3.7X more likely to have lung cancer than individuals currently recommended for LCDT by the USPTF. Finally, individuals whose scores fall within the high range are 8.9X more likely to have lung cancer than individuals currently recommended for LCDT by the USPTF. This categorization table will inform the physician about the degree of the lung cancer risk patient has after a positive result on the test.
The NPV is the proportion of people with a negative test result who do not have the disease, which was above 99.7% for the PAULAs test.
USING MACHINE LEARNING AND ADVANCED ANALYTICS
Machine Learning is a form of artificial intelligence (AI) in which a computer system has the ability to continually process and incorporate new data and thus fine tune its output over time. Because the algorithm used to combine and interpret patient biomarker levels with relevant clinical factor data is derived from machine learning, this algorithm is amenable to periodic review and redefinition.
While the current algorithm is fixed on the basis of rigorous studies performed to date, 20/20 GeneSystems, Inc. is committed to the performance of regular review of the algorithm as the existing patient dataset grows.
By providing 20/20 GeneSystems, Inc. with outcome data from patient follow-up subsequent to PAULAs test, real-world experiences can inform further development and fine-tuning of the PAULAs test algorithm and continuously improve the accuracy of the test.